
Page 97 - PDI_Report
P. 97
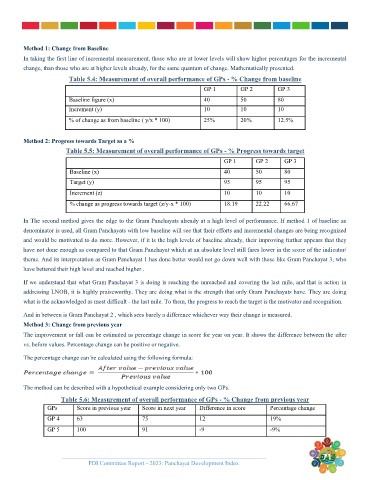
Method 1: Change from Baseline
         In taking the first line of incremental measurement, those who are at lower levels will show higher percentages for the incremental

         change, than those who are at higher levels already, for the same quantum of change. Mathematically presented.
                        Table 5.4: Measurement of overall performance of GPs - % Change from baseline
                                                                    GP 1         GP 2        GP 3
                        Baseline figure (x)                         40           50          80
                        Increment (y)                               10           10          10
                        % of change as from baseline ( y/x * 100)   25%          20%         12.5%


         Method 2: Progress towards Target as a %
                       Table 5.5: Measurement of overall performance of GPs - % Progress towards target
                                                                           GP 1       GP 2     GP 3
                        Baseline (x)                                       40         50       80
                        Target (y)                                         95         95       95
                        Increment (z)                                      10         10       10

                        % change as progress towards target (z/y-x * 100)   18.19     22.22    66.67

         In The second method gives the edge to the Gram Panchayats already at a high level of performance. If method 1 of baseline as
         denominator is used, all Gram Panchayats with low baseline will see that their efforts and incremental changes are being recognized
         and would be motivated to do more. However, if it is the high levels of baseline already, their improving further appears that they
         have not done enough as compared to that Gram Panchayat which at an absolute level still fares lower in the score of the indicator/
         theme. And its interpretation as Gram Panchayat 1 has done better would not go down well with those like Gram Panchayat 3, who
         have bettered their high level and reached higher .

         If we understand that what Gram Panchayat 3 is doing is reaching the unreached and covering the last mile, and that is action in
         addressing LNOB, it is highly praiseworthy. They are doing what is the strength that only Gram Panchayats have. They are doing
         what is the acknowledged as most difficult - the last mile. To them, the progress to reach the target is the motivator and recognition.
         And in between is Gram Panchayat 2 , which sees barely a difference whichever way their change is measured.
         Method 3: Change from previous year
         The improvement or fall can be estimated as percentage change in score for year on year. It shows the difference between the after

         vs. before values. Percentage change can be positive or negative.
         The percentage change can be calculated using the following formula:


         The method can be described with a hypothetical example considering only two GPs.

                     Table 5.6: Measurement of overall performance of GPs - % Change from previous year
                 GPs      Score in previous year   Score in next year   Difference in score   Percentage change
                 GP 4     63                    75                 12                     19%
                 GP 5     100                   91                 -9                     -9%


                              PDI Committee Report - 2023: Panchayat Development Index                      71