
Page 116 - PDI_Report
P. 116
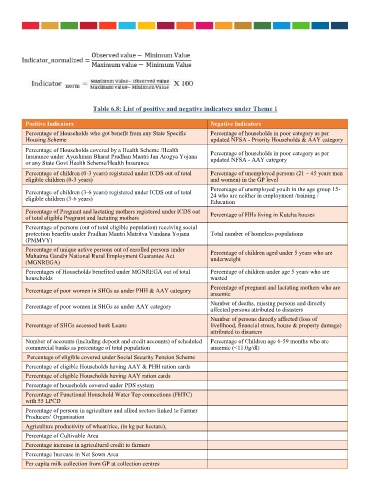
Table 6.8: List of positive and negative indicators under Theme 1

         Positive Indicators                                           Negative Indicators
         Percentage of Households who got benefit from any State Specific   Percentage of households in poor category as per
         Housing Scheme                                                updated NFSA - Priority Households & AAY category
         Percentage of Households covered by a Health Scheme /Health   Percentage of households in poor category as per
         Insurance under Ayushman Bharat Pradhan Mantri Jan Arogya Yojana
         or any State Govt Health Scheme/Health Insurance              updated NFSA - AAY category
         Percentage of children (0-3 years) registered under ICDS out of total   Percentage of unemployed persons (21 – 45 years men
         eligible children (0-3 years)                                 and women) in the GP level
                                                                       Percentage of unemployed youth in the age group 15-
         Percentage of children (3-6 years) registered under ICDS out of total   24 who are neither in employment /training /
         eligible children (3-6 years)
                                                                       Education
         Percentage of Pregnant and lactating mothers registered under ICDS out
         of total eligible Pregnant and lactating mothers              Percentage of HHs living in Kutcha houses
         Percentage of persons (out of total eligible population) receiving social
         protection benefits under Pradhan Mantri Matritva Vandana Yojana   Total number of homeless populations
         (PMMVY)
         Percentage of unique active persons out of enrolled persons under   Percentage of children aged under 5 years who are
         Mahatma Gandhi National Rural Employment Guarantee Act
         (MGNREGA)                                                     underweight
         Percentages of Households benefited under MGNREGA out of total   Percentage of children under age 5 years who are
         households                                                    wasted
                                                                       Percentage of pregnant and lactating mothers who are
         Percentage of poor women in SHGs as under PHH & AAY category
                                                                       anaemic
                                                                       Number of deaths, missing persons and directly
         Percentage of poor women in SHGs as under AAY category
                                                                       affected persons attributed to disasters
                                                                       Number of persons directly affected (loss of
         Percentage of SHGs accessed bank Loans                        livelihood, financial stress, house & property damage)
                                                                       attributed to disasters
         Number of accounts (including deposit and credit accounts) of scheduled   Percentage of Children age 6-59 months who are
         commercial banks as percentage of total population            anaemic (<11.0g/dl)
          Percentage of eligible covered under Social Security Pension Scheme
         Percentage of eligible Households having AAY & PHH ration cards
         Percentage of eligible Households having AAY ration cards
         Percentage of households covered under PDS system
         Percentage of Functional Household Water Tap connections (FHTC)
         with 55 LPCD
         Percentage of persons in agriculture and allied sectors linked to Farmer
         Producers’ Organisation
         Agriculture productivity of wheat/rice, (in kg per hectare),
         Percentage of Cultivable Area
         Percentage increase in agricultural credit to farmers
         Percentage Increase in Net Sown Area
             90
                                               PDI Committee Report - 2023: Proof of Concept
         Per capita milk collection from GP at collection centres                                                  90