
Page 215 - PDI_Report
P. 215
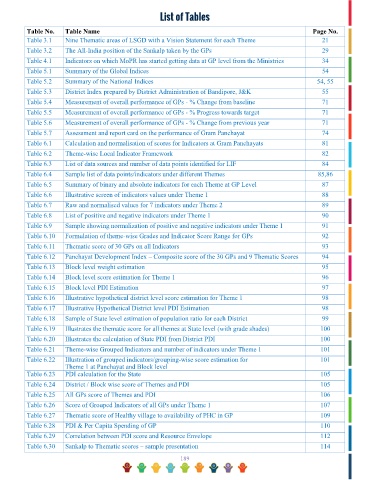
List of Tables


          Table No.    Table Name                                                                        Page No.
          Table 3.1    Nine Thematic areas of LSGD with a Vision Statement for each Theme                   21
          Table 3.2    The All-India position of the Sankalp taken by the GPs                               29
          Table 4.1    Indicators on which MoPR has started getting data at GP level from the Ministries    34
          Table 5.1    Summary of the Global Indices                                                        54
          Table 5.2    Summary of the National Indices                                                    54, 55
          Table 5.3    District Index prepared by District Administration of Bandipore, J&K                 55
          Table 5.4    Measurement of overall performance of GPs - % Change from baseline                   71

          Table 5.5    Measurement of overall performance of GPs - % Progress towards target                71
          Table 5.6    Measurement of overall performance of GPs - % Change from previous year              71
          Table 5.7    Assessment and report card on the performance of Gram Panchayat                      74
          Table 6.1    Calculation and normalisation of scores for Indicators at Gram Panchayats            81
          Table 6.2    Theme-wise Local Indicator Framework                                                 82
          Table 6.3    List of data sources and number of data points identified for LIF                    84
          Table 6.4    Sample list of data points/indicators under different Themes                       85,86

          Table 6.5    Summary of binary and absolute indicators for each Theme at GP Level                 87
          Table 6.6    Illustrative screen of indicators values under Theme 1                               88
          Table 6.7    Raw and normalised values for 7 indicators under Theme 2                             89
          Table 6.8    List of positive and negative indicators under Theme 1                               90
          Table 6.9    Sample showing normalization of positive and negative indicators under Theme 1       91
          Table 6.10   Formulation of theme-wise Grades and Indicator Score Range for GPs                   92
          Table 6.11   Thematic score of 30 GPs on all Indicators                                           93
          Table 6.12   Panchayat Development Index – Composite score of the 30 GPs and 9 Thematic Scores    94
          Table 6.13   Block level weight estimation                                                        95

          Table 6.14   Block level score estimation for Theme 1                                             96
          Table 6.15   Block level PDI Estimation                                                           97
          Table 6.16   Illustrative hypothetical district level score estimation for Theme 1                98
          Table 6.17   Illustrative Hypothetical District level PDI Estimation                              98
          Table 6.18   Sample of State level estimation of population ratio for each District               99
          Table 6.19   Illustrates the thematic score for all themes at State level (with grade shades)    100
          Table 6.20   Illustrates the calculation of State PDI from District PDI                          100

          Table 6.21   Theme-wise Grouped Indicators and number of indicators under Theme 1                101
          Table 6.22   Illustration of grouped indicators/grouping-wise score estimation for               101
                       Theme 1 at Panchayat and Block level
          Table 6.23   PDI calculation for the State                                                       105
          Table 6.24   District / Block wise score of Themes and PDI                                       105
          Table 6.25   All GPs score of Themes and PDI                                                     106
          Table 6.26   Score of Grouped Indicators of all GPs under Theme 1                                107
          Table 6.27   Thematic score of Healthy village to availability of PHC in GP                      109
          Table 6.28   PDI & Per Capita Spending of GP                                                     110
          Table 6.29   Correlation between PDI score and Resource Envelope                                 112

          Table 6.30   Sankalp to Thematic scores – sample presentation                                    114
                                                             189